30067 can be classified socioeconomically as Lower Middle Class class compared to other ZIP Codes in Georgia based on Median Household Income and Average Adjusted Gross Income. The majority race/ethnicity residing in 30067 is White. The majority race/ethnicity attending public schools in 30067 is African American. The current unemployment level in 30067 is 3.5%.
| Population | 46,595 |
| Population Growth Rate | 0.00% |
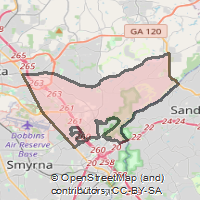
| Population Density | 3,135 People per Square Mile |
| Total Households | 18,932 |
| Percentage High Income Households | 6.9% |
| Median Household Income (2021) | $64,149 |
| Average Adjusted Gross Income (2021) | $874,680 |
| Current Unemployment Rate (January 2025) | 3.5% |
| Majority Race/Ethnicty | White - 52.18% |
| Public School Majority Race/Ethnicty | African American - 36.43% |
30067 Race/Ethnicty Breakdown
| Race/Ethnicty | Total | Percentage |
|---|
| White | 23,344 | 52.16% |
| Black | 12,526 | 27.99% |
| Hispanic | 5,280 | 11.8% |
| Asian | 3,375 | 7.54% |
| Native American | 210 | 0.47% |
| Hawaiian/Pac. Islander | 20 | 0.04% |
30067 Public School Race/Ethnicty Breakdown
| Race/Ethnicty | Total | Percentage |
|---|
| White | 967 | 27.41% |
| Black | 1,341 | 38.01% |
| Hispanic | 821 | 23.27% |
| Asian | 383 | 10.86% |
| Native American | 14 | 0.4% |
| Hawaiian/Pac. Islander | 2 | 0.06% |
30067 Educational Attainment Levels
| Highest Education Level Attained | Total | Percentage |
|---|
| Less Than 1 Year of College | 1,408 | 5.26% |
| Bachelor Degree | 9,336 | 34.9% |
| High School Diploma | 4,364 | 16.31% |
| No High School Diploma | 175 | 0.65% |
| GED or Alternate | 559 | 2.09% |
| 1 or More Years of College | 4,624 | 17.28% |
| Associates Degree | 1,804 | 6.74% |
| Masters Degree | 3,394 | 12.69% |
| Professional Degree | 774 | 2.89% |
| Doctorate Degree | 314 | 1.17% |