30252 can be classified socioeconomically as Middle Class class compared to other ZIP Codes in Georgia based on Median Household Income and Average Adjusted Gross Income. The majority race/ethnicity residing in 30252 is White. The majority race/ethnicity attending public schools in 30252 is White. The current unemployment level in 30252 is 3.3%.
| Population | 48,271 |
| Population Growth Rate | 0.00% |
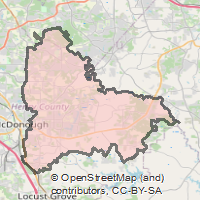
| Population Density | 524 People per Square Mile |
| Total Households | 13,584 |
| Percentage High Income Households | 3.0% |
| Median Household Income (2021) | $91,220 |
| Average Adjusted Gross Income (2021) | $357,610 |
| Current Unemployment Rate (May 2026) | 3.3% |
| Sales Tax Rate (2025) | 8.0% |
| Majority Race/Ethnicty | White - 60.00% |
| Public School Majority Race/Ethnicty | White - 45.31% |
30252 Race/Ethnicty Breakdown
| Race/Ethnicty | Total | Percentage |
|---|
| White | 27,713 | 60% |
| Black | 14,227 | 30.8% |
| Hispanic | 2,709 | 5.87% |
| Asian | 1,458 | 3.16% |
| Native American | 78 | 0.17% |
| Hawaiian/Pac. Islander | 0 | 0% |
30252 Public School Race/Ethnicty Breakdown
| Race/Ethnicty | Total | Percentage |
|---|
| White | 4,271 | 47.87% |
| Black | 3,558 | 39.87% |
| Hispanic | 766 | 8.58% |
| Asian | 295 | 3.31% |
| Native American | 25 | 0.28% |
| Hawaiian/Pac. Islander | 8 | 0.09% |
30252 Educational Attainment Levels
| Highest Education Level Attained | Total | Percentage |
|---|
| Less Than 1 Year of College | 1,706 | 6.85% |
| Bachelor Degree | 4,259 | 17.11% |
| High School Diploma | 7,714 | 30.98% |
| No High School Diploma | 338 | 1.36% |
| GED or Alternate | 1,250 | 5.02% |
| 1 or More Years of College | 5,279 | 21.2% |
| Associates Degree | 2,105 | 8.45% |
| Masters Degree | 1,769 | 7.11% |
| Professional Degree | 300 | 1.2% |
| Doctorate Degree | 177 | 0.71% |