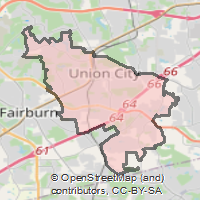
30291 can be classified socioeconomically as Lower Middle Class class compared to other ZIP Codes in Georgia based on Median Household Income and Average Adjusted Gross Income. The majority race/ethnicity residing in 30291 is African American. The majority race/ethnicity attending public schools in 30291 is African American. The current unemployment level in 30291 is 3.3%.
| Population | 25,024 |
| Population Growth Rate | 0.00% |
| Population Density | 2,413 People per Square Mile |
| Total Households | 8,152 |
| Percentage High Income Households | 0.4% |
| Median Household Income (2021) | $38,268 |
| Average Adjusted Gross Income (2021) | $288,930 |
| Current Unemployment Rate (May 2026) | 3.3% |
| Sales Tax Rate (2025) | 7.8% |
| Majority Race/Ethnicty | African American - 92.96% |
| Public School Majority Race/Ethnicty | African American - 85.69% |
30291 Race/Ethnicty Breakdown
| Race/Ethnicty | Total | Percentage |
|---|
| White | 1,099 | 4.71% |
| Black | 21,710 | 92.96% |
| Hispanic | 545 | 2.33% |
| Asian | 0 | 0% |
| Native American | 0 | 0% |
| Hawaiian/Pac. Islander | 0 | 0% |
30291 Public School Race/Ethnicty Breakdown
| Race/Ethnicty | Total | Percentage |
|---|
| White | 21 | 1.02% |
| Black | 1,797 | 87.45% |
| Hispanic | 228 | 11.09% |
| Asian | 6 | 0.29% |
| Native American | 3 | 0.15% |
| Hawaiian/Pac. Islander | 0 | 0% |
30291 Educational Attainment Levels
| Highest Education Level Attained | Total | Percentage |
|---|
| Less Than 1 Year of College | 903 | 8.26% |
| Bachelor Degree | 2,393 | 21.9% |
| High School Diploma | 3,162 | 28.93% |
| No High School Diploma | 186 | 1.7% |
| GED or Alternate | 457 | 4.18% |
| 1 or More Years of College | 2,354 | 21.54% |
| Associates Degree | 771 | 7.06% |
| Masters Degree | 616 | 5.64% |
| Professional Degree | 56 | 0.51% |
| Doctorate Degree | 30 | 0.27% |